ABSTRACT
This paper presents an automatic modulation and coding scheme (MCS) level adaptation algorithm to embrace Internet of Things (IoT) devices by improving the area spectral efficiency of carrier-sense multiple access with collision avoidance (CSMA/CA) wireless networks. In the proposed algorithm, senders of CSMA/CA wireless networks use the signal to interference plus noise ratio of acknowledgment frames from their receivers to estimate channel statuses between the senders and the receivers.
Using the estimated channel status of each receiver, senders control sending rates of traffic by adjusting MCS levels of packets destined for each receiver. We use Poisson point processes (PPPs) to model the locations of participating nodes (i.e., access points and wireless devices) in a given area. We evaluate the effectiveness of the proposed algorithm using an event-driven ns-2 simulator for various PPP densities of access points and wireless devices.
RELATED WORK
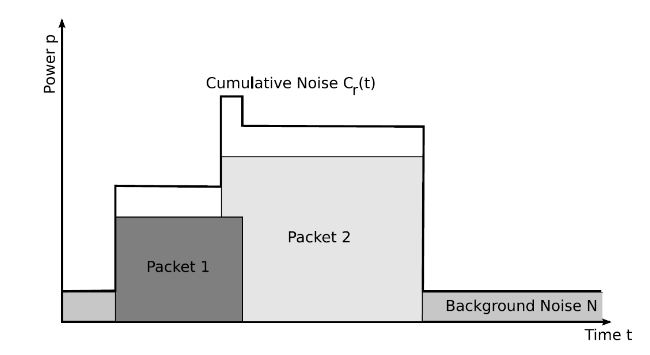
Figure 1. Changes of cumulative power
Within the module, nodes not only use signal strengths and arrival times of packets but also use the sizes and transmission speeds of the arrived packets (i.e., durations) to calculate cumulative power at the nodes. The cumulative power is used to calculate the SINRs of packets when and while they are received. Figure 1 illustrates the changes of the cumulative power (described as cumulative noise in the figure) when packets of different received signal strengths and durations arrive at a node.
PROPOSED ALGORITHM
We consider wireless networks consisting of N nodes in a two-dimensional Euclidean space. For the calculation of the signal strengths and SINRs of received packets, we use a simple radio transmission model similar to the one used in (Equation (1)) except for the random channel gains for simplicity in analysis.
DEMONSTRATIONS USING SIMULATIONS
To demonstrate how the proposed MCS level adaptation algorithm works, we first use the simple topology shown in Figure 2. The figure shows a simulation environment in which there are only one wireless device (WD1) and one access point (AP0) in an area of 2000 × 2000 m. In the figure, the solid arrow line from AP0 to WD1 represents the CBR data flow from AP0 to WD1. In addition, as shown with the dashed arrow line in the figure, WD1 moves from its initial location of (681, 240) to its final location of (1800, 1800) during 10 s of simulation time. AP0 is located at about (1334, 1001).
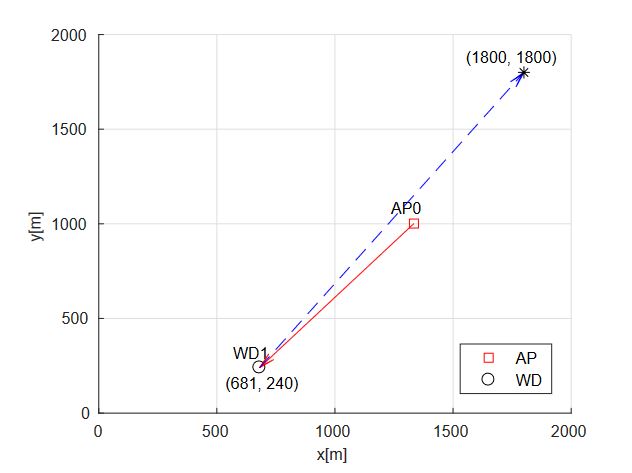
Figure 2. WD1 moves passing its serving access point (AP0) in an area of 2000 × 2000 m
To demonstrate the behavior of the proposed algorithm in an environment with multiple cells (i.e., multiple APs) and multiple users, in Figure 5, we show a Voronoi diagram where 10 APs and 10 wireless devices are located in an area of 2000 × 2000 m. The APs and the wireless devices in the figure are randomly distributed in the area using two independent homogeneous PPPs of the same density. The solid arrow lines in the figure show connectivities between APs and wireless devices. The lines also represent the CBR traffic flows from APs to their associated wireless devices.
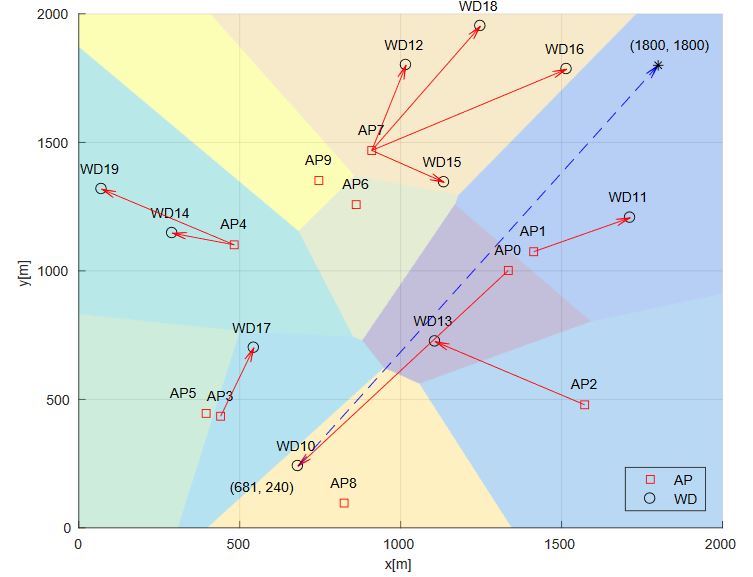
Figure 5. Voronoi diagram of multiple cells and multiple users
PERFORMANCE EVALUATION
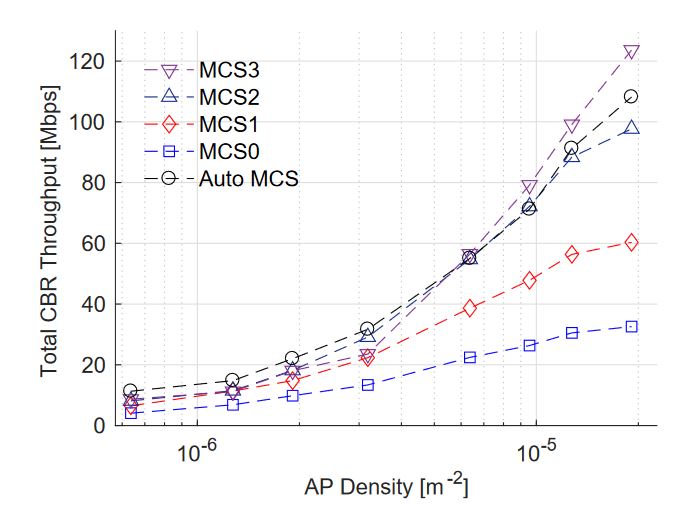
Figure 9. Total achieved throughputs
In this section, we first show the simulation results when both the number of APs and the number of wireless devices increase from 2 to 60 (i.e., 2, 4, 6, 10, 20, 30, 40, and 60) in a circular area with a radius of 1000 m. In Figure 9, we show the total (i.e., aggregated) throughputs achieved by all wireless devices when a fixed MCS level is used for communications of all participants in different PPP densities of APs for 2 s. The total throughputs are averaged values from 10 repetitions of each scenario.
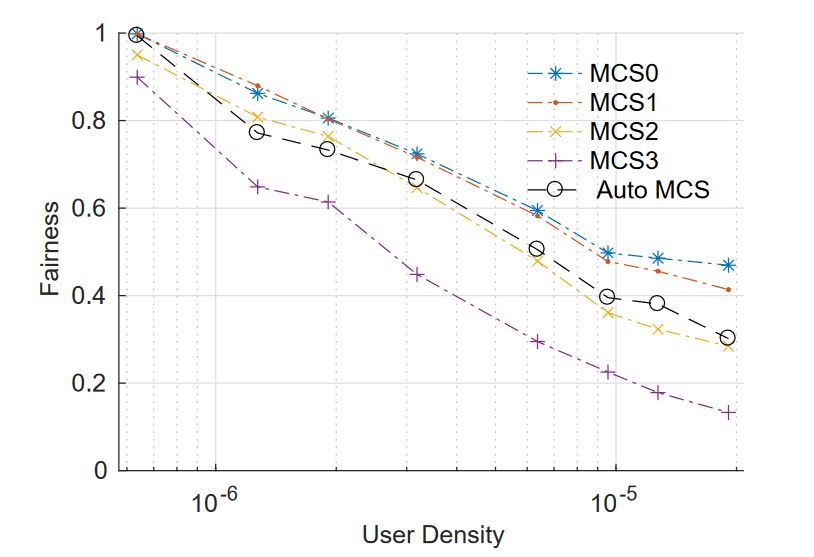
Figure 19. Fairness among user throughputs
In Figure 19, we show the throughput fairness among the varying numbers of the wireless devices with different MCS levels when the number of APs is fixed at 30. The results in the figure show that users achieve better fairness with the proposed algorithm than with the highest MCS level, similarly to the results in Figures 13 and 16. However, the results show high fairness for low densities of users compared to the results in Figures 13 and 16. This is partly because, when there are only small numbers of wireless devices in the area we simulated, the APs associated with them are located relatively far from each other because of the PPP density of the APs.
CONCLUSIONS
In this paper, we propose an automatic MCS level adaptation algorithm using SINRs of ACK frames in CSMA/CA wireless networks to accommodate the expected high density of IoT devices in CSMA/CA wireless networks. The proposed algorithm does not require any modification of the existing CSMA/CA mechanism because it is based on the information from normal ACK frames in IEEE 802.11 standards. Our simulation results show that the proposed algorithm utilizes resources of IEEE 802.11a wireless networks almost as effectively as the highest MCS level of a given MCS scheme for various combinations of PPP densities of access points and wireless devices.
In addition, we show through simulations that the proposed algorithm results in low retry limit ratios in sent packets compared to those of the highest MCS level. Furthermore, the fairness among per user throughputs also exhibits better results than those of the highest MCS level. Since the proposed algorithm works in a purely distributed manner and is less aggressive than the highest MCS level, we expect other performance improvements to be further revealed in the near future.
Source: Hongik University
Author: Soohyun Cho
>> 200+ IoT Led Projects for Final Year Students
>> More B.Com Computer Application Projects