ABSTRACT
With the rapid development of Internet of Things (IoT), more and more static and mobile sensors are being deployed for sensing and tracking environmental phenomena, such as fire, oil spills and air pollution. As these sensors are usually battery-powered, energy-efficient algorithms are required to extend the sensors lifetime. Moreover, forwarding sensed data towards a static sink causes quick battery depletion of the sinks nearby sensors. Therefore, in this paper, we propose a distributed energy-efficient algorithm, called the Hilbert-order Collection Strategy (HCS), which uses a mobile sink (e.g., drone) to collect data from a mobile wireless sensor network (mWSN) and detect environmental phenomena.
The mWSN consists of mobile sensors that sense environmental data. These mobile sensors self-organize themselves into groups. The sensors of each group elect a group head (GH), which collects data from the mobile sensors in its group. Periodically, a mobile sink passes by the locations of the GHs (data collection path) to collect their data. The collected data are aggregated to discover a global phenomenon. To shorten the data collection path, which results in reducing the energy cost, the mobile sink establishes the path based on the order of Hilbert values of the GHs locations. Furthermore, the paper proposes two optimization techniques for data collection to further reduce the energy cost of mWSN and reduce the data loss.
RELATED WORK
IoT has been recently used to intelligently monitor the environment. Using a large number of sensing devices that are interconnected, environment information is sensed and reported to a sink to detect and track phenomena. Detecting phenomena using sensor networks has received the attention of many researchers in the data mining community. In this section, we survey the related work of phenomena detection by sensor networks.
HCS DESIGN ISSUES

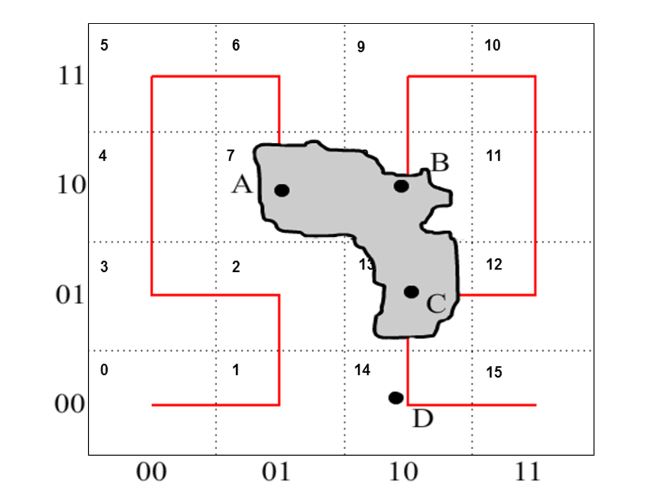
Figure 2. An example that shows the data collection path of all group heads
The Hilbert-order value of a specific GH is determined based on its (x, y) location in a two-dimensional space. Figure 2 shows an example of four group heads {A, B, C, D}. The space is a grid of size 4 × 4 cells. The Hilbert order of all groups will be computed by MS. The Hilbert-order value of GH A is formed by interleaving the value 01 of the x-coordinate and the value 10 of the y-coordinate. Thus, the Hilbert-order value of the group head A is (0111).
PHENOMENA DETECTION USING mWSN AND MS
At the beginning of every window, the new GHs announce themselves (broadcast their IDs) to the sensors in the environment. Then, each sensor associates itself to the closest GH; this is called Group Formation phase, see Figure 1. In the Local Phenomena Reporting phase, sensors that sensed phenomena report two types of information to their GHs: (1) sensed phenomena information; and (2) sensor status information (remaining battery power, speed and direction). Each GH collects the phenomena information from the sensors within its group and then it aggregates the collected information to discover local phenomena (phenomena within the boundaries of its group).
ENERGY COST MODEL

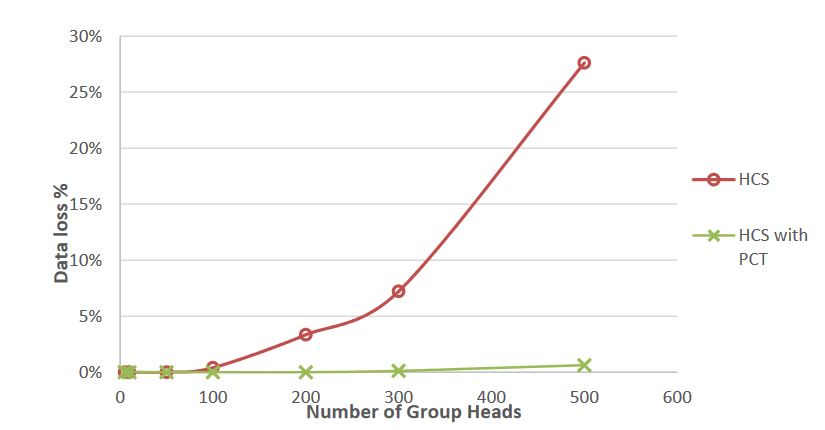
Figure 5. Comparing the data loss percentage using Hilbert Collection Strategy and different participating strategy
In Figure 5, given an mWSN with fixed number of mobile sensors, this experiment compares the percentage of data loss of the proposed HCS with that of the HCS with PCT. Note that HCS with PCT is similar to the HCS except that MS passes by only the GHs that detected the phenomena instead of all GHs in the environment. The experiment compares HCS and the HCS with PCT algorithms on the data loss for different number of GHs. In Figure 5, the x-axis represents the number of GHs in the environment and the y-axis represents the percentage of data loss averaged over 50 experiments.

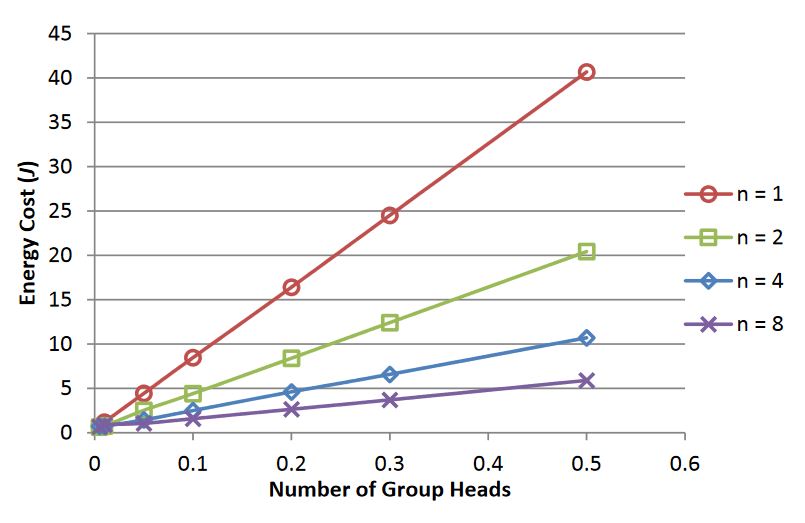
Figure 7. Effect of LUT at the end of the n th window ( n = 1, 2, 4 and 8)
Figure 7 shows that total energy cost by updating every 8th window is the lowest. HCS corresponds to the case where n = 1; that is the update of new GHs is performed at the end of every window. Therefore, the proposed LUT optimization reduces the energy cost as compared to HCS. However, the chances of losing some phenomena data becomes higher as the value of n increases. The reason is that as the frequency of updating the GHs becomes lower, the possibility of phenomena moving to other regions increases.
CONCLUSIONS
This paper addresses the problem of detecting phenomena such as oil spills, air pollution, etc., in the IoT environment. The environment consists of mobile sensors, mWSN and a mobile sink, MS. We proposed a distributed energy-efficient scheme to detect environmental phenomena from the data collected by the mWSN. These mobile sensors self-organize themselves into groups and elect a GH for each group. Each GH collects data from sensors in its group to detect possible local phenomena. The MS passes by GHs locations to collect the group’s data and discover the global phenomena. To reduce the energy cost of the mWSN, the paper proposes an efficient data collection strategy, called HCS. In HCS, the order of data collection by MS is based on the Hilbert-order of all GHs locations.
To further reduce the energy cost of mWSN, the paper proposes two data collection optimization techniques. The proposed solutions are validated using a comprehensive set of experiments. We implemented the mWSN using NS2 network simulator. Our simulation results show that HCS achieved a saving in the energy cost around 91.4% as compared to the base algorithm (Random). By combining HCS with PCT, the data loss decreased by 97.7% as compared with the HCS algorithm. Furthermore, LUT reduced the energy cost by about 50% if LUT is applied at n = 2 and 75% if it was applied at n = 4.
Source: University of Sharjah
Authors: Amany Abu Safia | Zaher Al Aghbari | Ibrahim Kamel
>> 200+ IoT Led Engineering Projects for Students